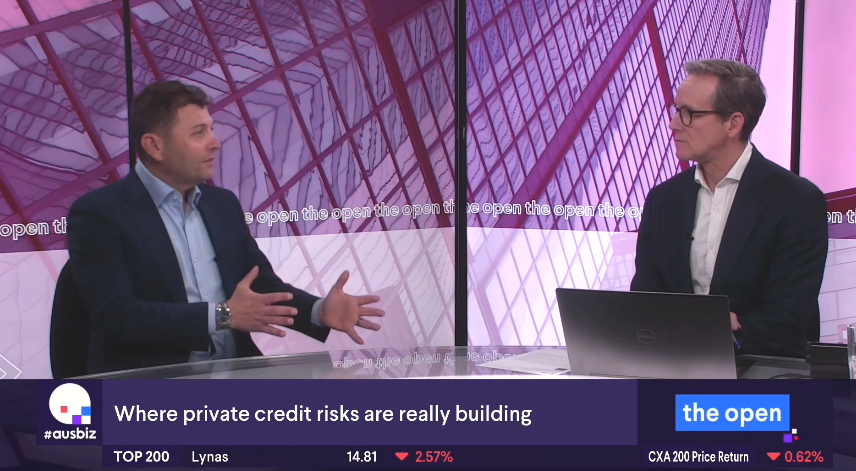
A major developer in distress, billions in debt spread across the private credit market, and a wave of investor phone calls asking one question: am I exposed? Msquared Capital Co-Founder & Fund Manager Paul Miron explains the credit discipline behind Msquared Capital’s lending.
Over the past week there has been significant media coverage of a large Sydney property developer in distress, and of the private credit funds exposed to it. According to The Australian, more than 18 private credit funds have in excess of $3 billion in debt tied to the group. Predictably, investors have been calling to ask whether we have any exposure — and they are right to ask.
Investors should understand exactly what sits inside their portfolio — not just the headline return, but the type of debt they own and the risks that come with it. That is the real question this month’s article addresses.
“Msquared Capital has no lending exposure to the Bathla Group”
The current snapshot: a two-speed correction
On current data, national dwelling values are in a genuine correction. Our base case is a peak-to-trough fall of around 10%, but the national average hides what is happening at the extremes: some segments and geographies will correct considerably harder — beyond 15% — while others are merely braking1.
The auction clearance rate is the truest leading indicator, and it has been sitting below 50% in Sydney and Melbourne since late May. That is not softness. That is a correction the aggregate data now confirms.
Over the past year the split has become unmistakable. Sydney and Melbourne have rolled from solid gains into accelerating monthly falls (-1.2% and -1.0% in June). The mid-sized capital cities that led the boom — Perth, Brisbane, Adelaide — peaked around the turn of the year and are now decelerating hard from monthly gains above 2% toward flat.
The first chart below tracks all five mainland capital cities month by month, with the RBA’s three 2026 cash-rate hikes and the 12 May federal budget marked: Sydney and Melbourne accelerated lower through precisely that window. The correction is real, but it is not uniform, and that distinction matters enormously for anyone lending against property2,3.
Chart: Monthly dwelling change by capital city, July 2025 – June 2026
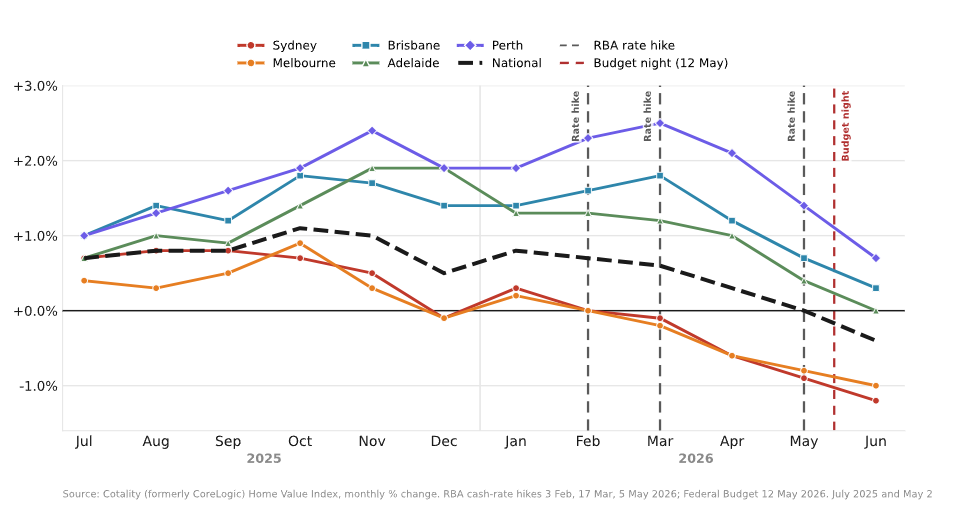
Based on Cotality Home Value Index, monthly % change by capital city, July 2025 – June 2026.
The deterioration in both the economy and property began early this year — the product of sticky inflation, higher interest rates and excess government spending. Post-budget, that deterioration has accelerated, draining confidence from the market. Housing remains the single largest contributor to inflation, running at 6.5% over the year. Advertised rents are still climbing against sub-2% vacancy, and while the official CPI rent measure has eased to 3.6%, that lagging series has yet to catch up to what new tenants are paying — so the pressure on the very renters this budget claimed to help is still in the pipeline3,4,5.
Crucially, none of this arrived without warning. The two most reliable leading indicators — consumer sentiment and auction clearance rates — both rolled over months before dwelling values turned negative. The second chart makes the sequence plain: national values sit as bars, with clearance rates and consumer sentiment overlaid as lines, and the three cash-rate hikes (February, March and May) and budget night marked.
Sentiment was already mired in deeply pessimistic territory and slid to a two-and-a-half-year low well before February’s first hike; clearance rates fell through 60% in March and below the 50% mark that historically signals sustained falls by late May. National values only tipped negative in June — just after the third hike and the budget landed together in May. Prices were the last domino, not the first6.
Chart: National prices vs auction clearances and consumer sentiment, July 2025 – June 2026
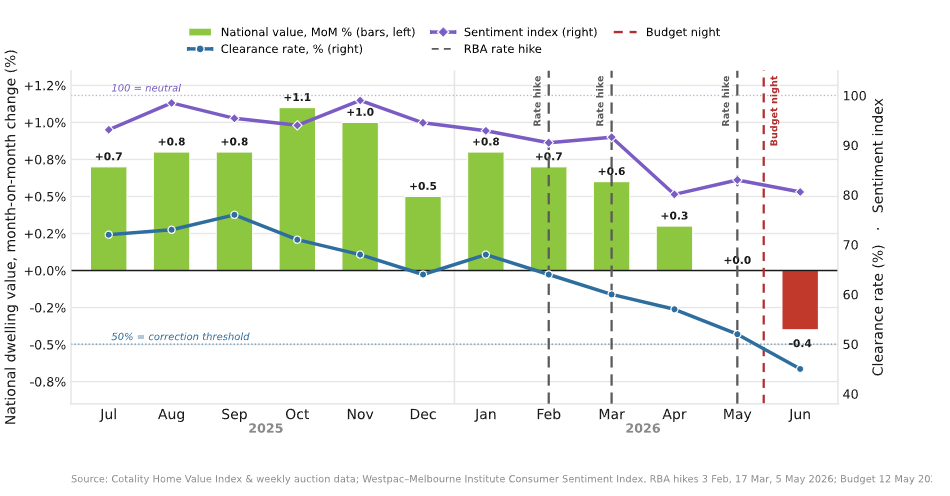
National dwelling value change (bars) against auction clearance rates and consumer sentiment (lines), July 2025 – June 2026. Sources: Cotality (formerly CoreLogic) Home Value Index — dwelling values, and weekly auction data — clearance rates (shown as monthly combined-capitals approximations); Westpac–Melbourne Institute Consumer Sentiment Index (100 = neutral). RBA cash-rate rises (3 Feb, 17 Mar, 5 May 2026) and the Federal Budget (12 May 2026) as marked.
Why is it going so wrong, so quickly?
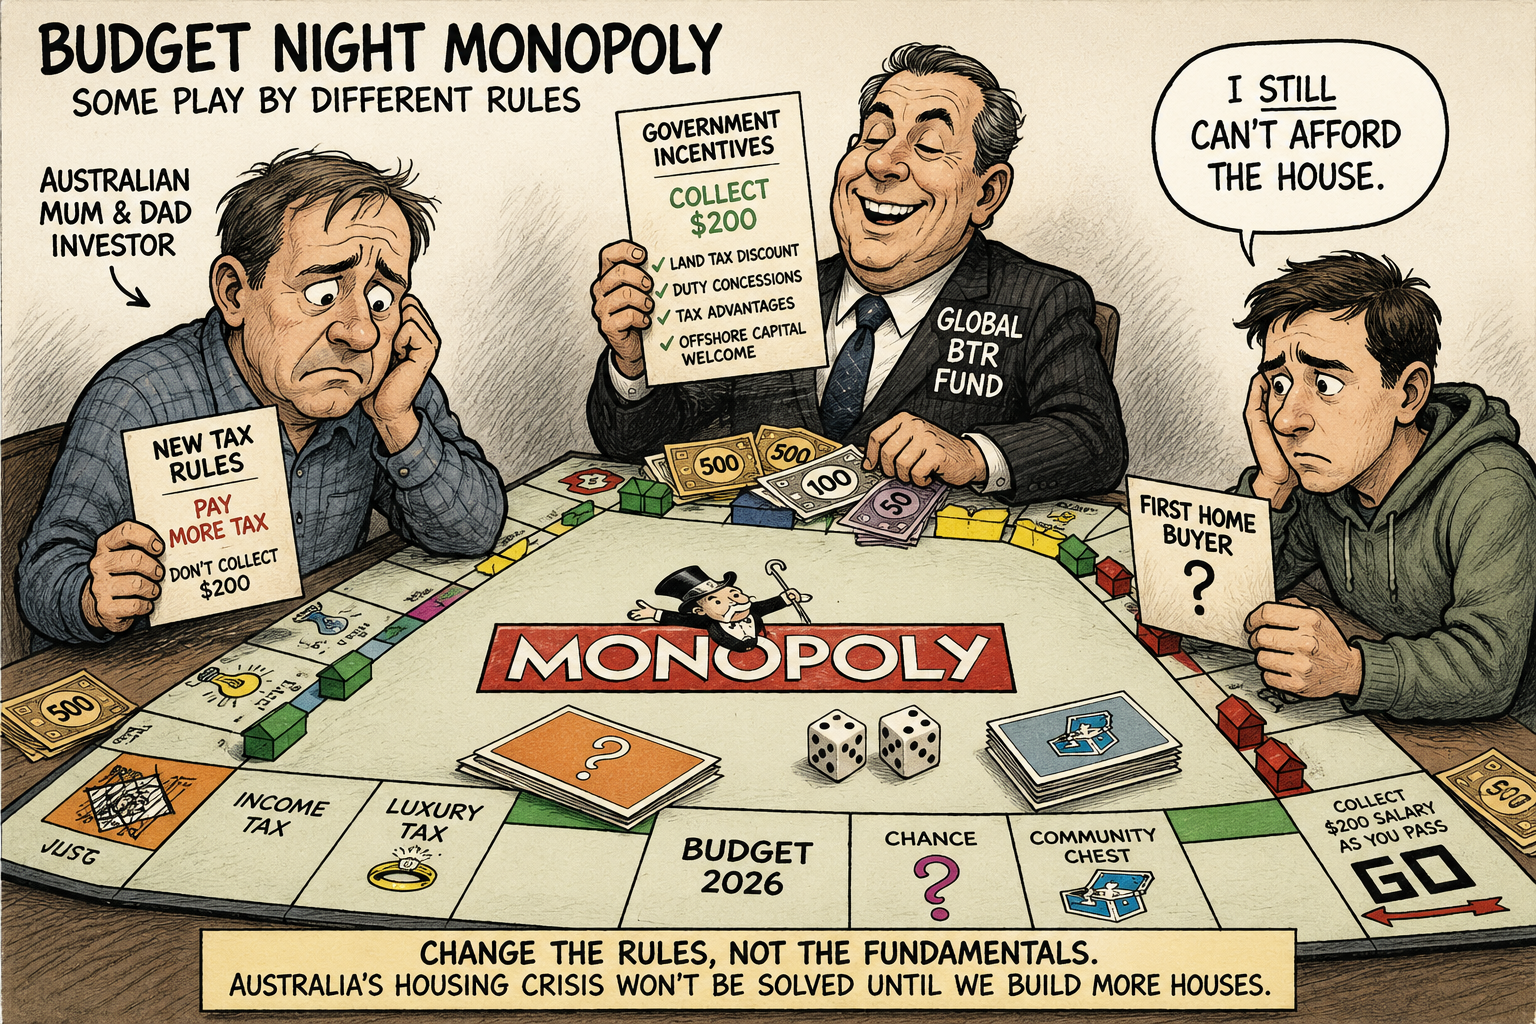
We were presented with a budget supposedly designed to fix the housing crisis and inequality. Its own papers show otherwise. The strategy was to dampen investor demand — investors transact around 40% of the market — in order to push prices down and call the result affordability, while offering nothing on the supply side.
The consequence is that the velocity of money and property transactions is falling off a cliff. That hits two groups hardest: property developers and state governments. Fewer sales mean less stamp duty, less business activity, and less of the revenue base that funds schools, hospitals and roads. Property in Australia is both the heart and the glue of the economy — and all of this is being done while raising taxes on the businesses that collectively employ five million people. The unintended consequence, in my view, is a catalyst that materially raises the risk of recession over the next two years.
Where this becomes a nightmare — and where the real risk sits
For a developer, a few months of slowing sales starves the cash flow needed to service interest, pay staff and buy materials. Margins were already thin; as prices fall and sales stall, debt can end up exceeding the value of the asset. That is a developer solvency problem, and it happens in every cycle. It is being reported as a private credit problem.
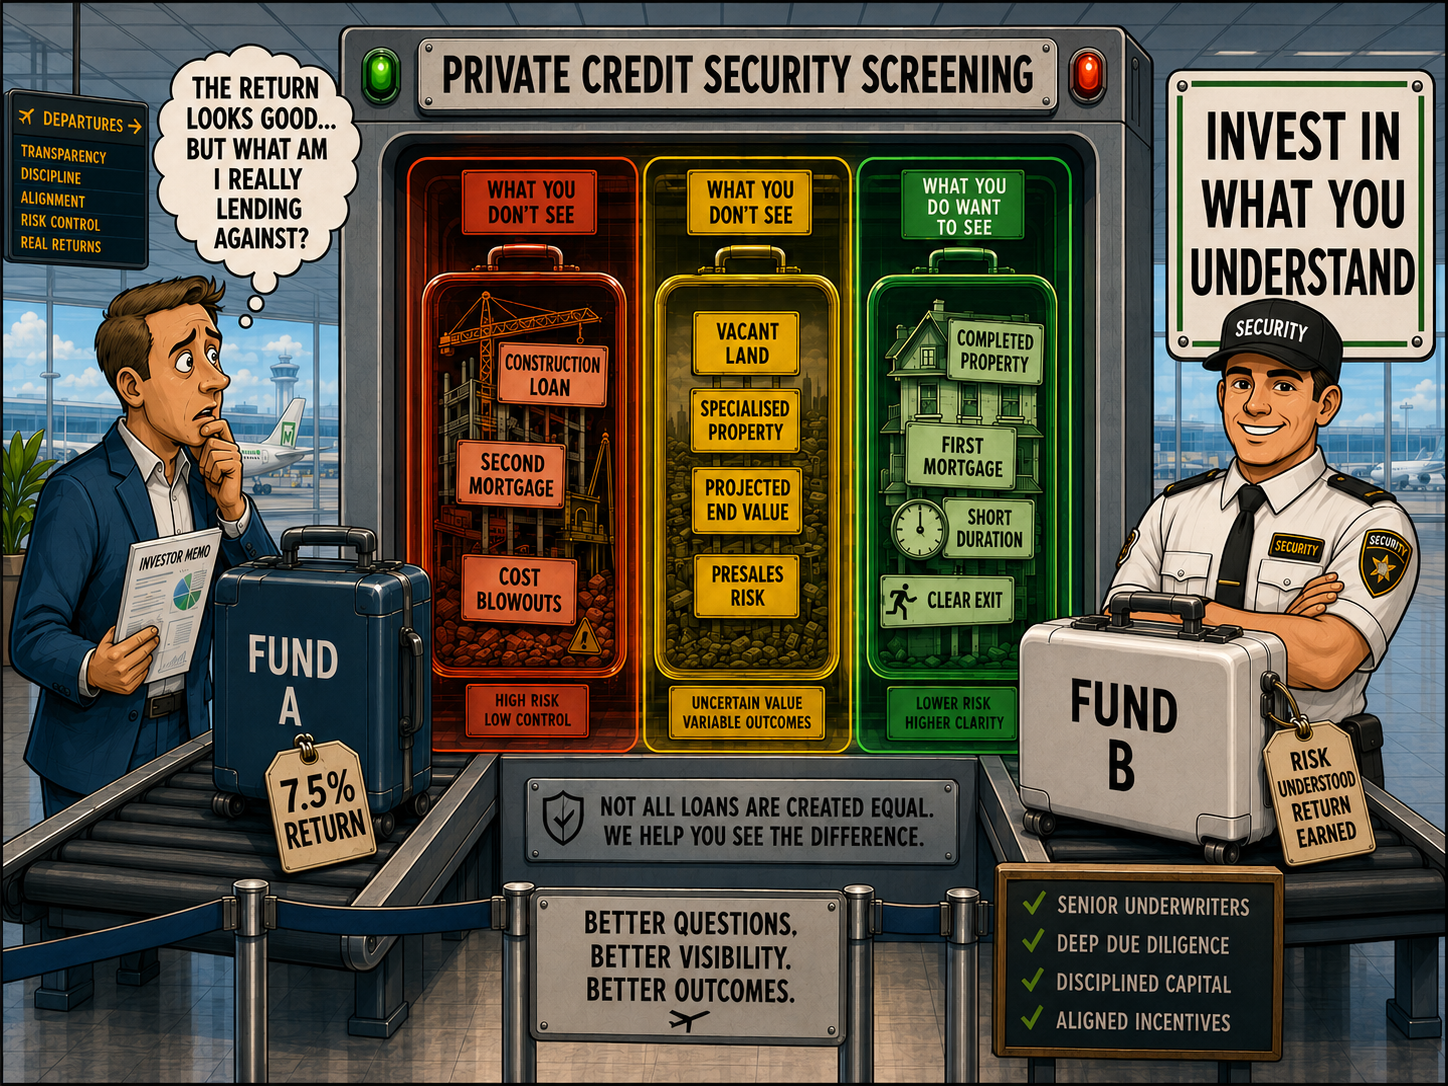
The distinction that matters is within secured private credit. In a traditional loan, security is a recovery mechanism: if the borrower defaults, you realise the asset and recover your capital and interest. A development loan layers on two additional risks — construction risk (cost escalation, the builder failing, supply chain) and construction specific market risk (relying on an end product selling at a price assumed years earlier). Right now both are moving against borrowers at once: higher build costs meeting softer end values.
This is the inherent risk of construction and development lending, and too often it is not priced in. As investors, allocators and advisers have chased higher returns, they have placed less emphasis on the type of loans sitting inside pooled funds. We had the warnings — the Adgemis collapse, and ASIC flagging its concern about private credit exposure to speculative real estate. The market was largely unfazed7.
Our long-standing investors have heard me say it hundreds of times before:
“There would come a day when the front page of the AFR carried a large developer collapse and losses on speculative construction and second-mortgage lending”.
Concentration risk is an issue
Concentration risk, investor perception and understanding of risk is the most important issue. What matters for investors is what actually sits beneath the label “private credit.” Lending to fund construction and development is a fundamentally different exposure to short-term business lending secured by completed property.
The former depends on a project being built and then sold at a price assumed years earlier; the latter is serviced from a borrower’s cash flow, with completed property as security. Both can be done well, but they do not carry the same risk — and a fund heavily concentrated in a single developer, or a single type of loan, can behave very differently when the cycle turns.
The lesson is a simple one, and it is the same one we have always put to investors: you should be able to see clearly what your capital is lending against, and understand how those structures are likely to behave under stress.
This is why the Msquared Mortgage Income Fund (MMIF)8 is built the way it is. Every loan is secured by a registered first-ranking mortgage over completed and established residential, commercial, retail or industrial real estate. The Fund does not lend for the construction or development of the security property, and does not lend against vacant land or a development project.
Borrowers are assessed on their character, cash flow and capacity to service the loan against a defined exit — because, as this cycle is making plain, servicing and exit matter as much as the security behind them.
We are not changing our approach, because the Fund was purpose-built for periods like this. What has changed is the opportunity set: as some lenders turn more cautious, well-secured short-term lending is, in our view, being priced more attractively.
So when an investor asks whether they are exposed to the next headline, our answer is the same as it has always been — ask your manager what you are lending against.
Disclaimer & sources
1 Property values are subject to a wide range of known and unknown risks, including but not limited to: changes in government policy and their impacts, interest rate movements, employment conditions, credit availability, and broader economic shocks. Actual outcomes may differ materially from any projections or ranges discussed.
2 Cotality, Monthly Housing Chart Pack — July 2026.
3 Reserve Bank of Australia, Cash Rate Target.
4 Australian Bureau of Statistics, Consumer Price Index, Australia, May 2026.
5 Cotality
6 Westpac–Melbourne Institute, Consumer Sentiment Bulletin, June 2026.
7 ASIC Report 814, Private credit in Australia (September 2025).
8 One Managed Investment Funds Limited ACN 117 400 987 AFSL 297042 (OIG) is responsible entity and issuer of units in Msquared Mortgage Income Fund ARSN 682 099 350 (MMIF or Fund). Msquared Capital Retail Funds Management Pty Ltd ACN 679 611 146 is the investment manager of MMIF (Manager). The Manager is a corporate authorised representative (no. 1312858) of One Investment Administration Ltd ACN 072 899 060 AFSL 225064 (OIAL) in respect of financial services provided to ‘retail clients’ (as defined in the Corporations Act) (Retail Clients). The Manager is also a corporate authorised representative (no. 1312533) of Msquared Capital Pty Ltd ACN 622 507 297 AFSL 520293 (Msquared Capital) in respect of financial services (including general financial product advice in relation to the Fund) provided to ‘wholesale clients’ only (as defined in the Corporations Act) (Wholesale Clients). The information provided on this website (Information) is general in nature and does not constitute investment or personal financial product advice, and does not take into account your investment objectives, particular needs or financial situation. You should seek independent financial advice. *Past performance is not a reliable indicator of future performance. The payment, specific rate of return and frequency of distributions are not guaranteed. Performance comparisons are provided purely for information purposes only and should not be relied upon. The Information may include information that is predictive in character which may be affected by inaccurate assumptions or by known or unknown risks and uncertainties and may differ materially from results ultimately achieved. Neither OIG, Msquared Capital, Manager nor any of their related entities guarantee the performance of the Fund or the repayment of any investor’s capital, and neither give any representation or warranty as to the reliability, completeness or accuracy of the Information and do not accept liability for any inaccurate, incomplete or omitted information or any losses caused by using this Information. Not an offer to invest. You should carefully consider the respective Fund’s disclosure documents, including Product Disclosure Statement (PDS) and Target Market Determination (TMD) for the MMIF before making any decision about whether to acquire, or continue to hold, an interest in the Fund. Applications for units in the Funds can only be made pursuant to the application form relevant to the Fund. The PDS and TMD can be obtained from www.msquaredcapital.com.au.
Msquared Capital Pty Ltd ACN 622 507 297 AFSL 520293. The information provided is general in nature and reflects the views of the author at the time of publication. Forward-looking information is inherently uncertain, and actual results may differ materially from projections. The information has been prepared without taking into account your objectives, financial situation or needs, and does not constitute personal financial product advice, investment advice or a recommendation. Not an offer to invest. Investments in the Fund’s products are not bank deposits and the performance of the Fund, return of capital or payment of distributions are not guaranteed. Before making any investment decision, you should consider whether the information is appropriate to your circumstances and seek independent financial advice.